




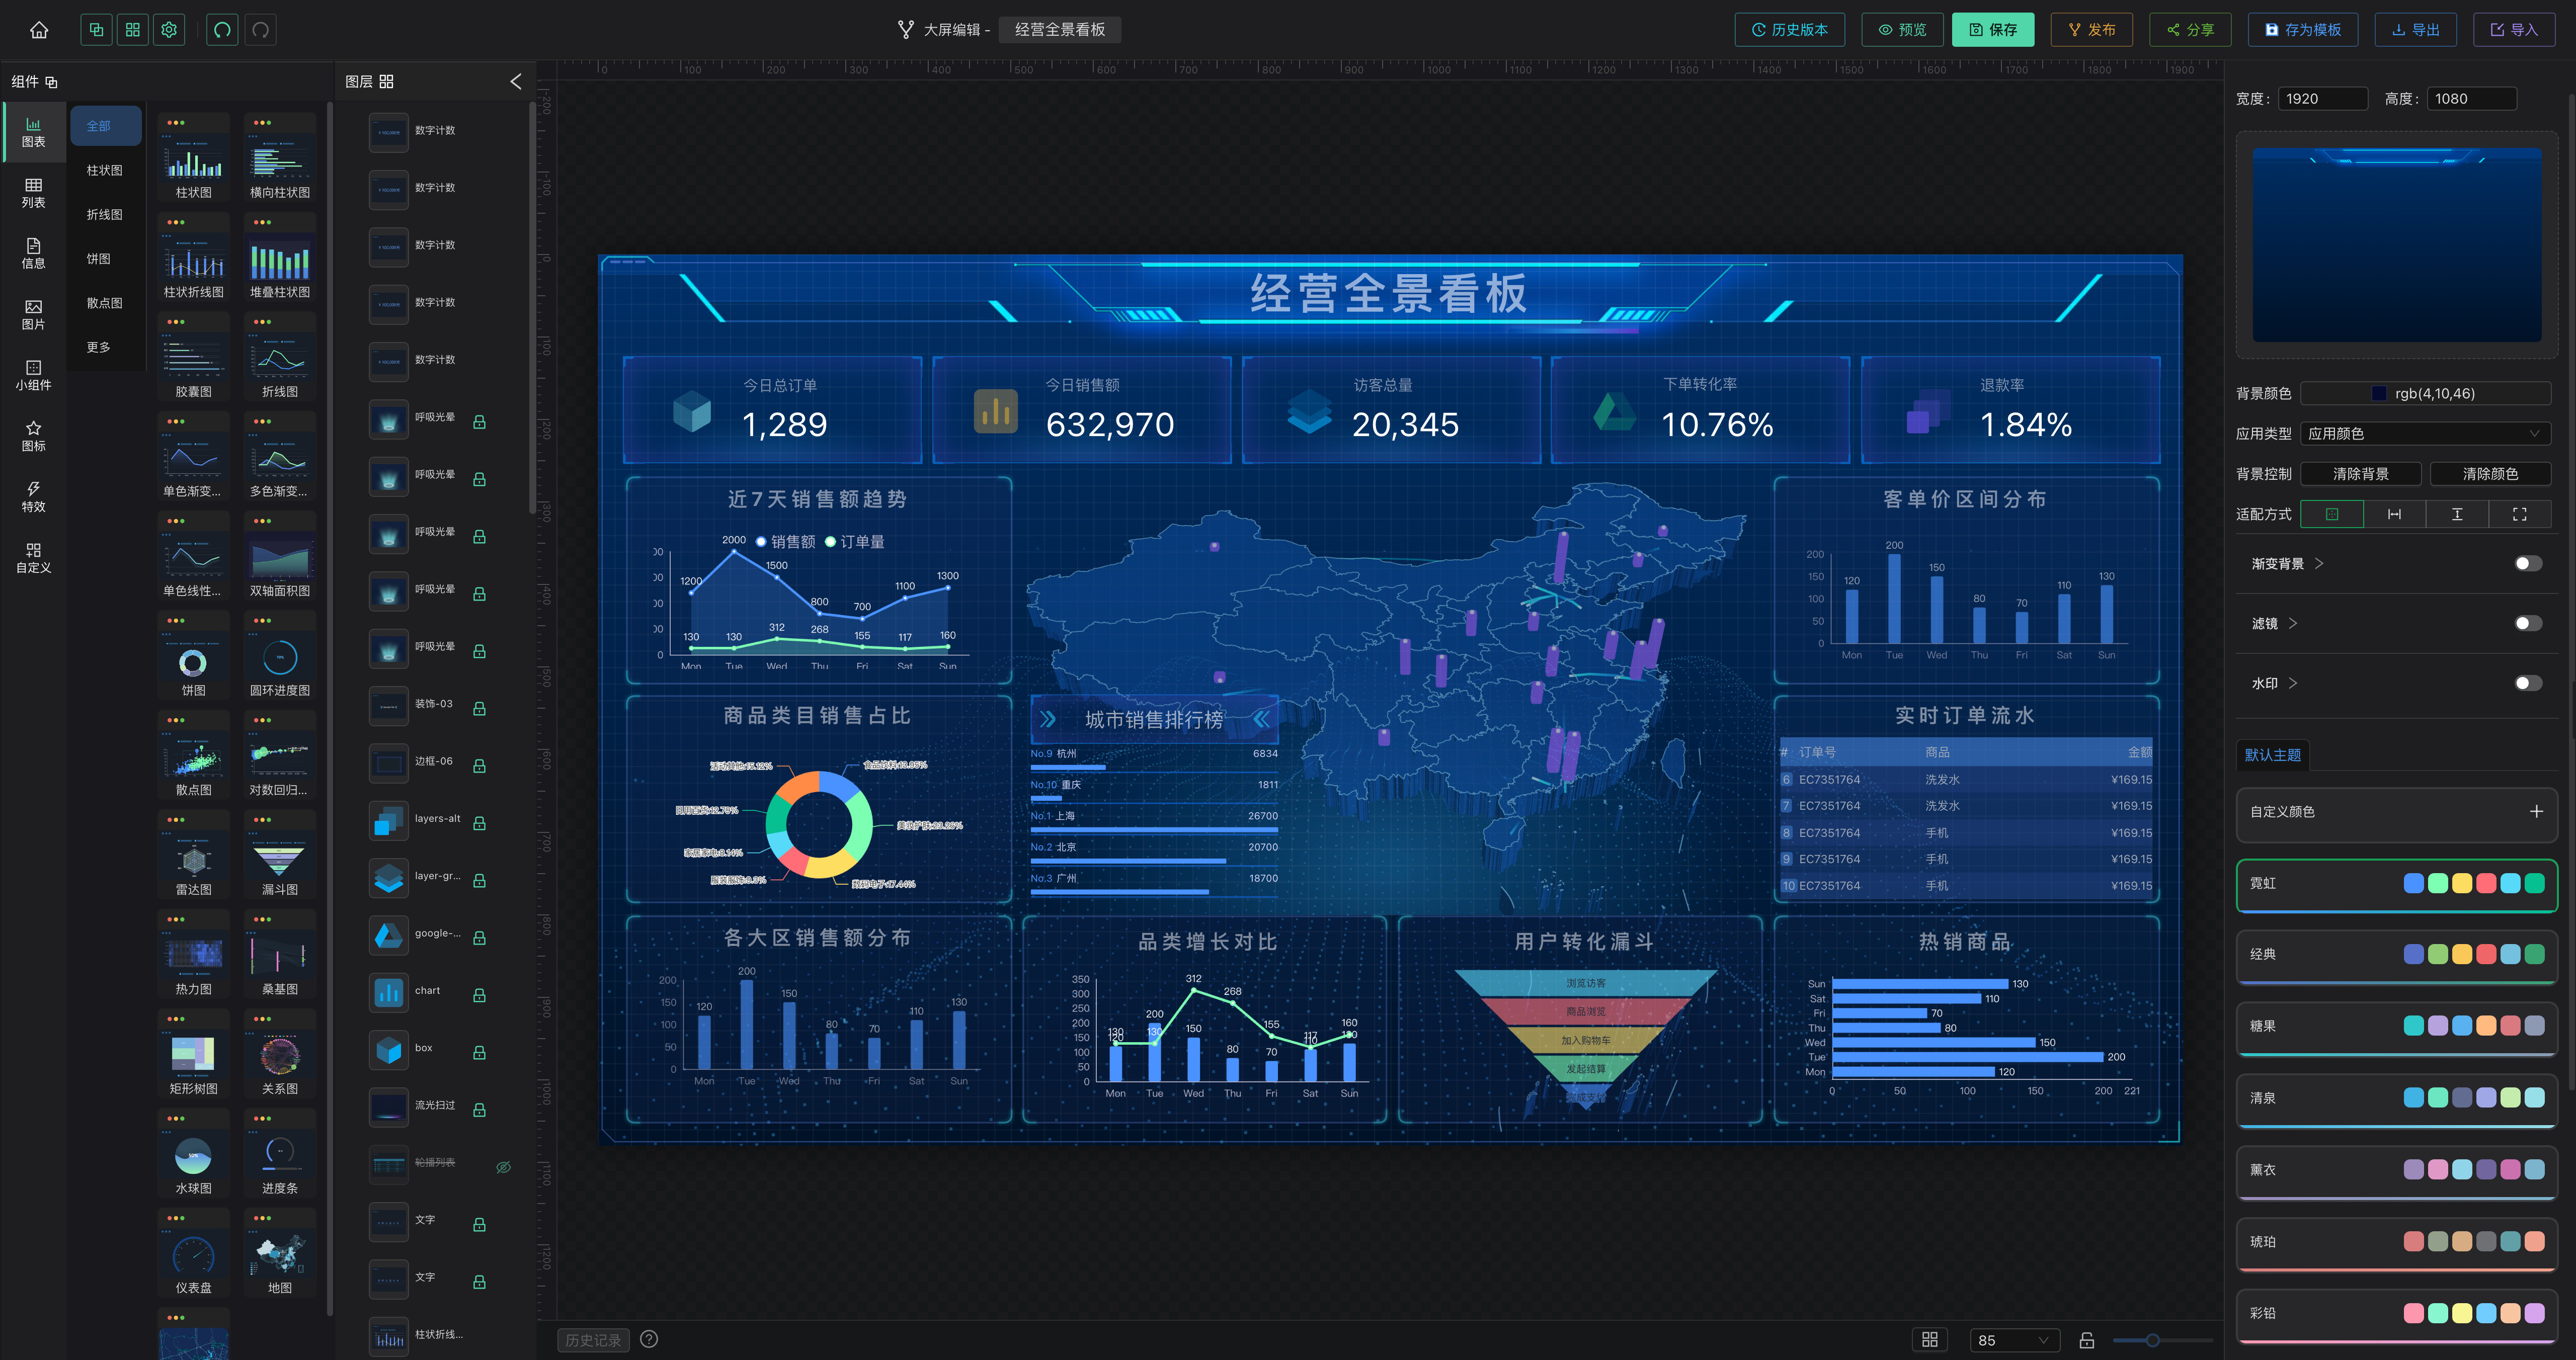
场景:可视化大屏编辑器。一块画布上可能同时存在几十个 ECharts 图表,用户会任意拖拽、缩放组件尺寸,图表还会定时轮询实时数据、跨图表联动高亮。在这样的高频 `setOption` + 频繁 `resize` 环境下,我遇到了两个非常典型、但官方文档几乎不讲的"玄学"问题。本文把它们的根因和工程化解法完整记录下来。下图是这套大屏编辑器的整体界面:左侧组件库、中间可自由拖拽缩放的画布、右侧配置面板。本文的两个问题都发生在中间画布的图表上。
一、`setOption` 突然全部失效:`__flagInMainProcess` 污染
1.1 现象
某个图表组件在跑了一段时间后,无论怎么改数据、怎么调配置,图表都不再更新了。控制台偶尔能看到这样一句告警:
setOption should not be called during main process但更多时候它连告警都没有——就是静默失效:`setOption` 调了,没报错,图表纹丝不动。刷新页面能恢复,跑一会儿又复现。定时轮询数据的大屏上,这个问题尤其致命。
1.2 根因
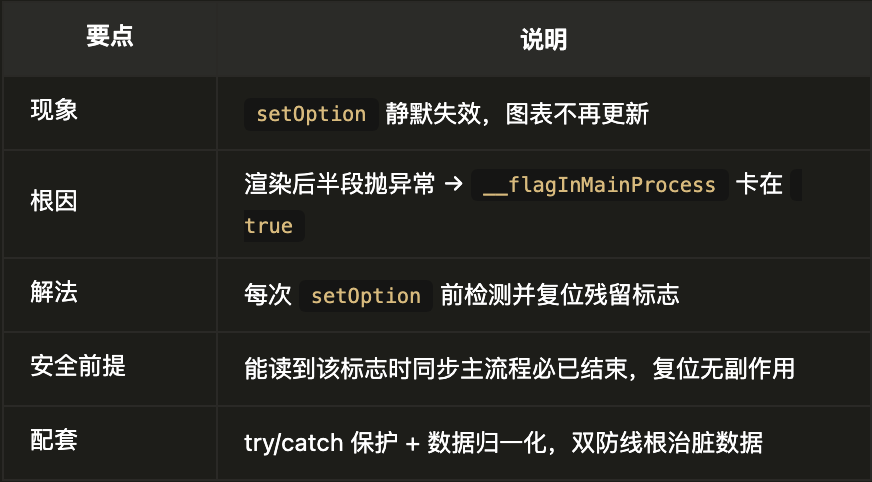
ECharts 5.x 内部有一个标志位 `__flagInMainProcess`,用来防止在"主渲染流程执行过程中"重入调用 `setOption`。正常流程是:
setOption 开始 → __flagInMainProcess = true → 计算/渲染 → zr flush → __flagInMainProcess = false问题在于:如果 `setOption` / 更新流程的后半段(比如 `zrender` 的 flush 渲染阶段)抛了异常,`__flagInMainProcess` 就永远卡在 `true` 出不来了。此后所有 `setOption` 调用都会被 ECharts 认为"你正在主流程里重入",于是被直接拒绝——而且是静默拒绝。
在大屏编辑器里,触发这个异常的来源非常多:
用户配的接口返回了脏数据(`value` 是 `undefined`、结构不匹配);
自定义 tooltip / formatter 回调里抛错;
组件在 `resize` 与 `setOption` 并发时的边界情况。
一旦踩中一次,这个图表实例就"废"了,只能重新 `init`。
1.3 解法:外部复位残留标志
关键洞察是:当我们的业务代码能观察到 `__flagInMainProcess` 这个标志时,ECharts 的同步主流程必然已经结束了。因为主流程是同步执行的,我们能读到它说明控制权已经回到我们手里。所以此刻如果它还是 `true`,那一定是上一次异常留下的"污染残留",直接复位即可,不会破坏任何正在进行的正常流程。
于是有了这个极简但有效的修复函数(`src/hooks/echartsRegistry.js`):
/**
 * 修复被内部主流程标志卡住的 echarts 实例
 * echarts 5.x 中 setOption/update 若在后半段(如 zr flush 渲染阶段)抛异常,
 * __flagInMainProcess 会卡在 true,之后所有 setOption 被静默拒绝
 * (`setOption should not be called during main process`),图表不再更新。
 * 外部能观察到该标志时 echarts 同步主流程必然已结束,残留即为污染,直接复位恢复。
 * @param {object} instance echarts 实例
 * @returns {boolean} 是否执行了修复
 */
export const repairStuckMainProcess = (instance) => {
  if (instance && instance.__flagInMainProcess) {
    instance.__flagInMainProcess = false;
    return true;
  }
  return false;
};
在每次 `setOption` **之前**调用它,把上一次可能残留的污染标志清掉:
// 修复 echarts 内部标志污染(卡住后 setOption 会被永久静默拒绝)
if (repairStuckMainProcess(chartInstance.current)) {
  console.warn("PieChart: 检测到 echarts 实例卡住,已自动修复");
}

// 设置配置(坏数据只告警不崩溃,保留上一次渲染)
try {
  optionRef.current = defaultOption;
  applyNow(true); // 内部调用 instance.setOption(...)
} catch (error) {
  console.warn("PieChart setOption 失败:", error);
}
1.4 配套的两条防线
光复位标志还不够,要配合两条防线才能彻底根治"脏数据搞挂图表":
防线一:`setOption` 用 try/catch 包住,坏数据只告警不崩溃。
上面代码里的 `try/catch` 很关键。即便这次 `setOption` 因为脏数据抛异常,我们也只是 `console.warn`,保留上一次的正常渲染结果,而不是让整个 React 组件崩溃白屏。下一次数据正常时,`repairStuckMainProcess` 会先复位标志,图表自动恢复。
防线二:数据归一化兜底,从源头减少异常。
轮询回来的数据先经过 `normalizeDataset` 归一化(把 `null` 转成 `{ source: [] }`、把 `"38"` 这种数字字符串转成数字),尽量不让脏数据进 `setOption`。这样即便防线一没触发,图表也能渲染出空坐标系而非报错。
1.5 为什么它被复用到所有图表
因为这是实例级的通用污染,跟具体图表类型无关。项目里 `EChartsBase`、`PieChart`、`LineChart`、`BarChart`、`RadarChart`、`WordCloud` 等**所有直接 `echarts.init` 的组件**,都在 `setOption` 前统一调用了 `repairStuckMainProcess`。一次封装,全局受益。
1.6 小结
二、图表缩小后文字错位:图例遮挡、标签被裁切
2.1 现象
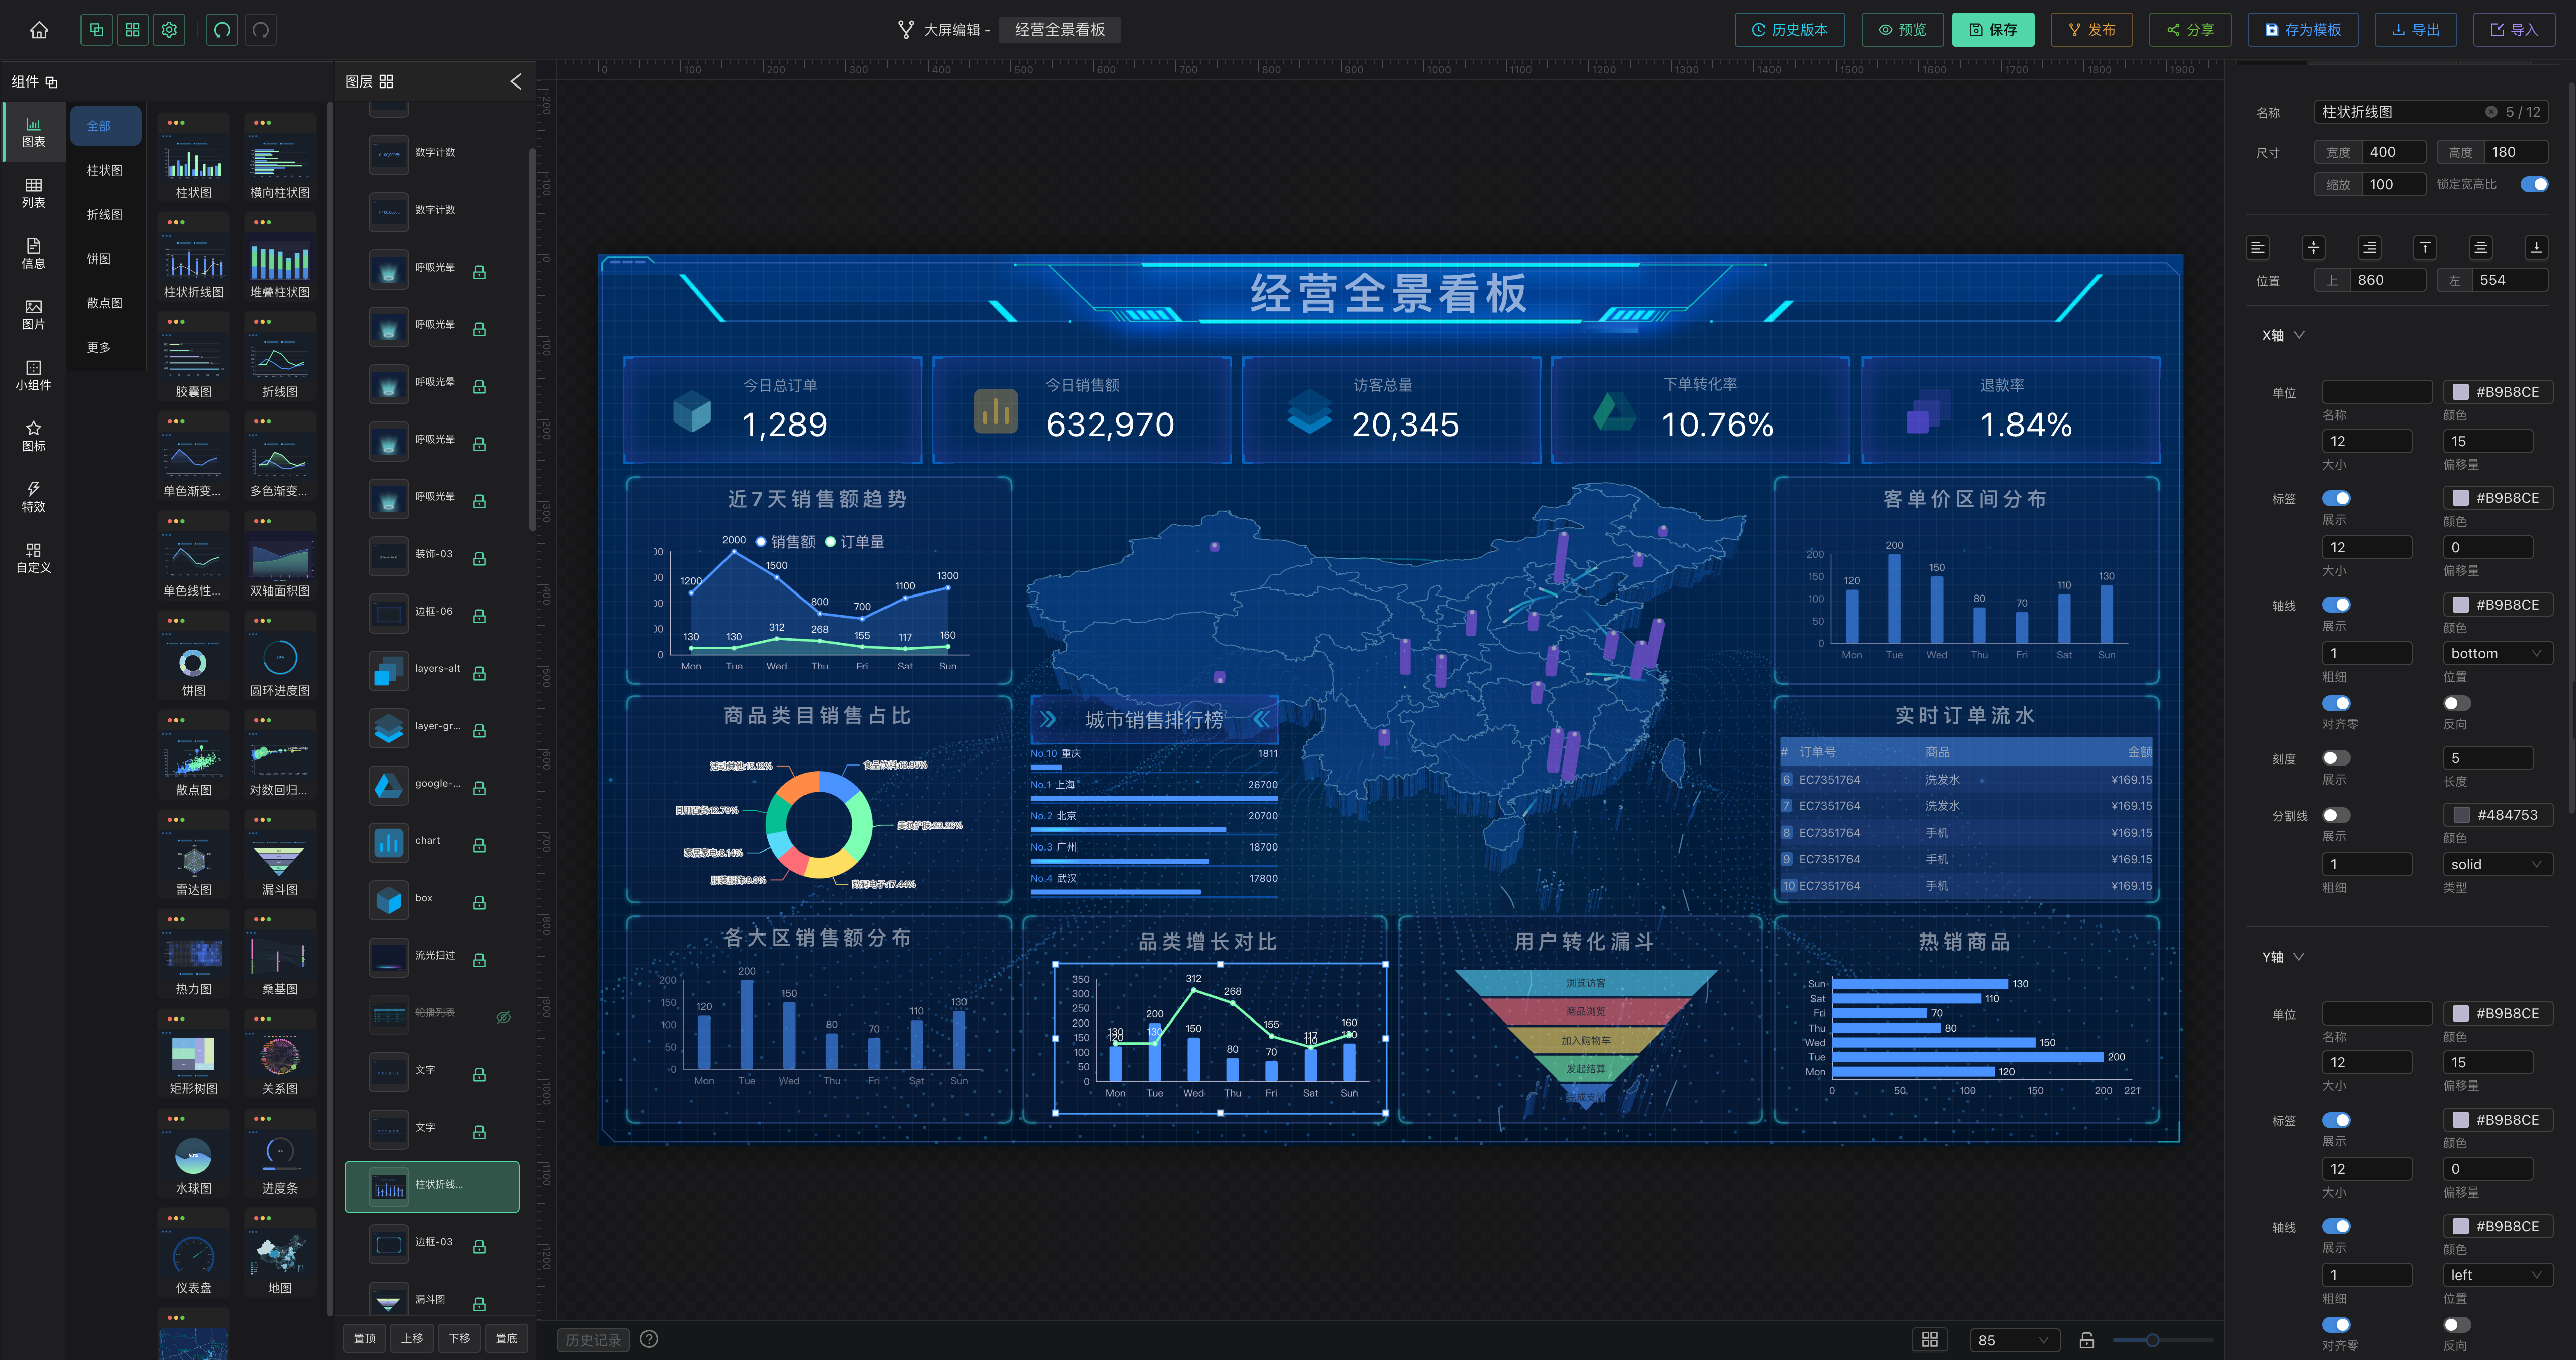
第二个问题更"日常",几乎每个做大屏的人都踩过。下图是画布上选中一个图表组件的状态,用户可以任意拖拽、缩放它:
一个在 **1920×1080 基准尺寸**下设计得很漂亮的图表,被用户拖拽缩小到 400×300 后:
图例(legend)字号没变**,还是 14px,直接把绘图区挤没了,甚至盖住坐标轴标签;
轴标签、数值标签**还是原来的像素字号,缩小后文字超出容器被裁掉一截;
用百分比设置的 `grid.bottom: '10%'` 留白,在大图上是 100px 够用,缩小后只剩 30px,图例直接压到 X 轴上。
一句话:绝对像素元素(字号、图标、间距)和百分比留白,在缩放时不同步。
2.2 根因
ECharts 的 `resize()` 只会重新计算布局和坐标系,不会缩放你写死的像素值。`fontSize: 14`、`itemWidth: 25`、`grid.bottom: '10%'` 这些配置,容器变小时它们不会自动跟着变小。于是绝对像素的东西"显得越来越大",百分比留白"显得越来越不够",两者打架,就出现了遮挡和裁切。
2.3 解法:一个统一的等比缩放 hook
思路很直接:算出容器当前尺寸相对基准尺寸的缩放系数 `ratio`,把所有绝对像素配置乘以 `ratio`,并把百分比留白替换成够用的像素值。
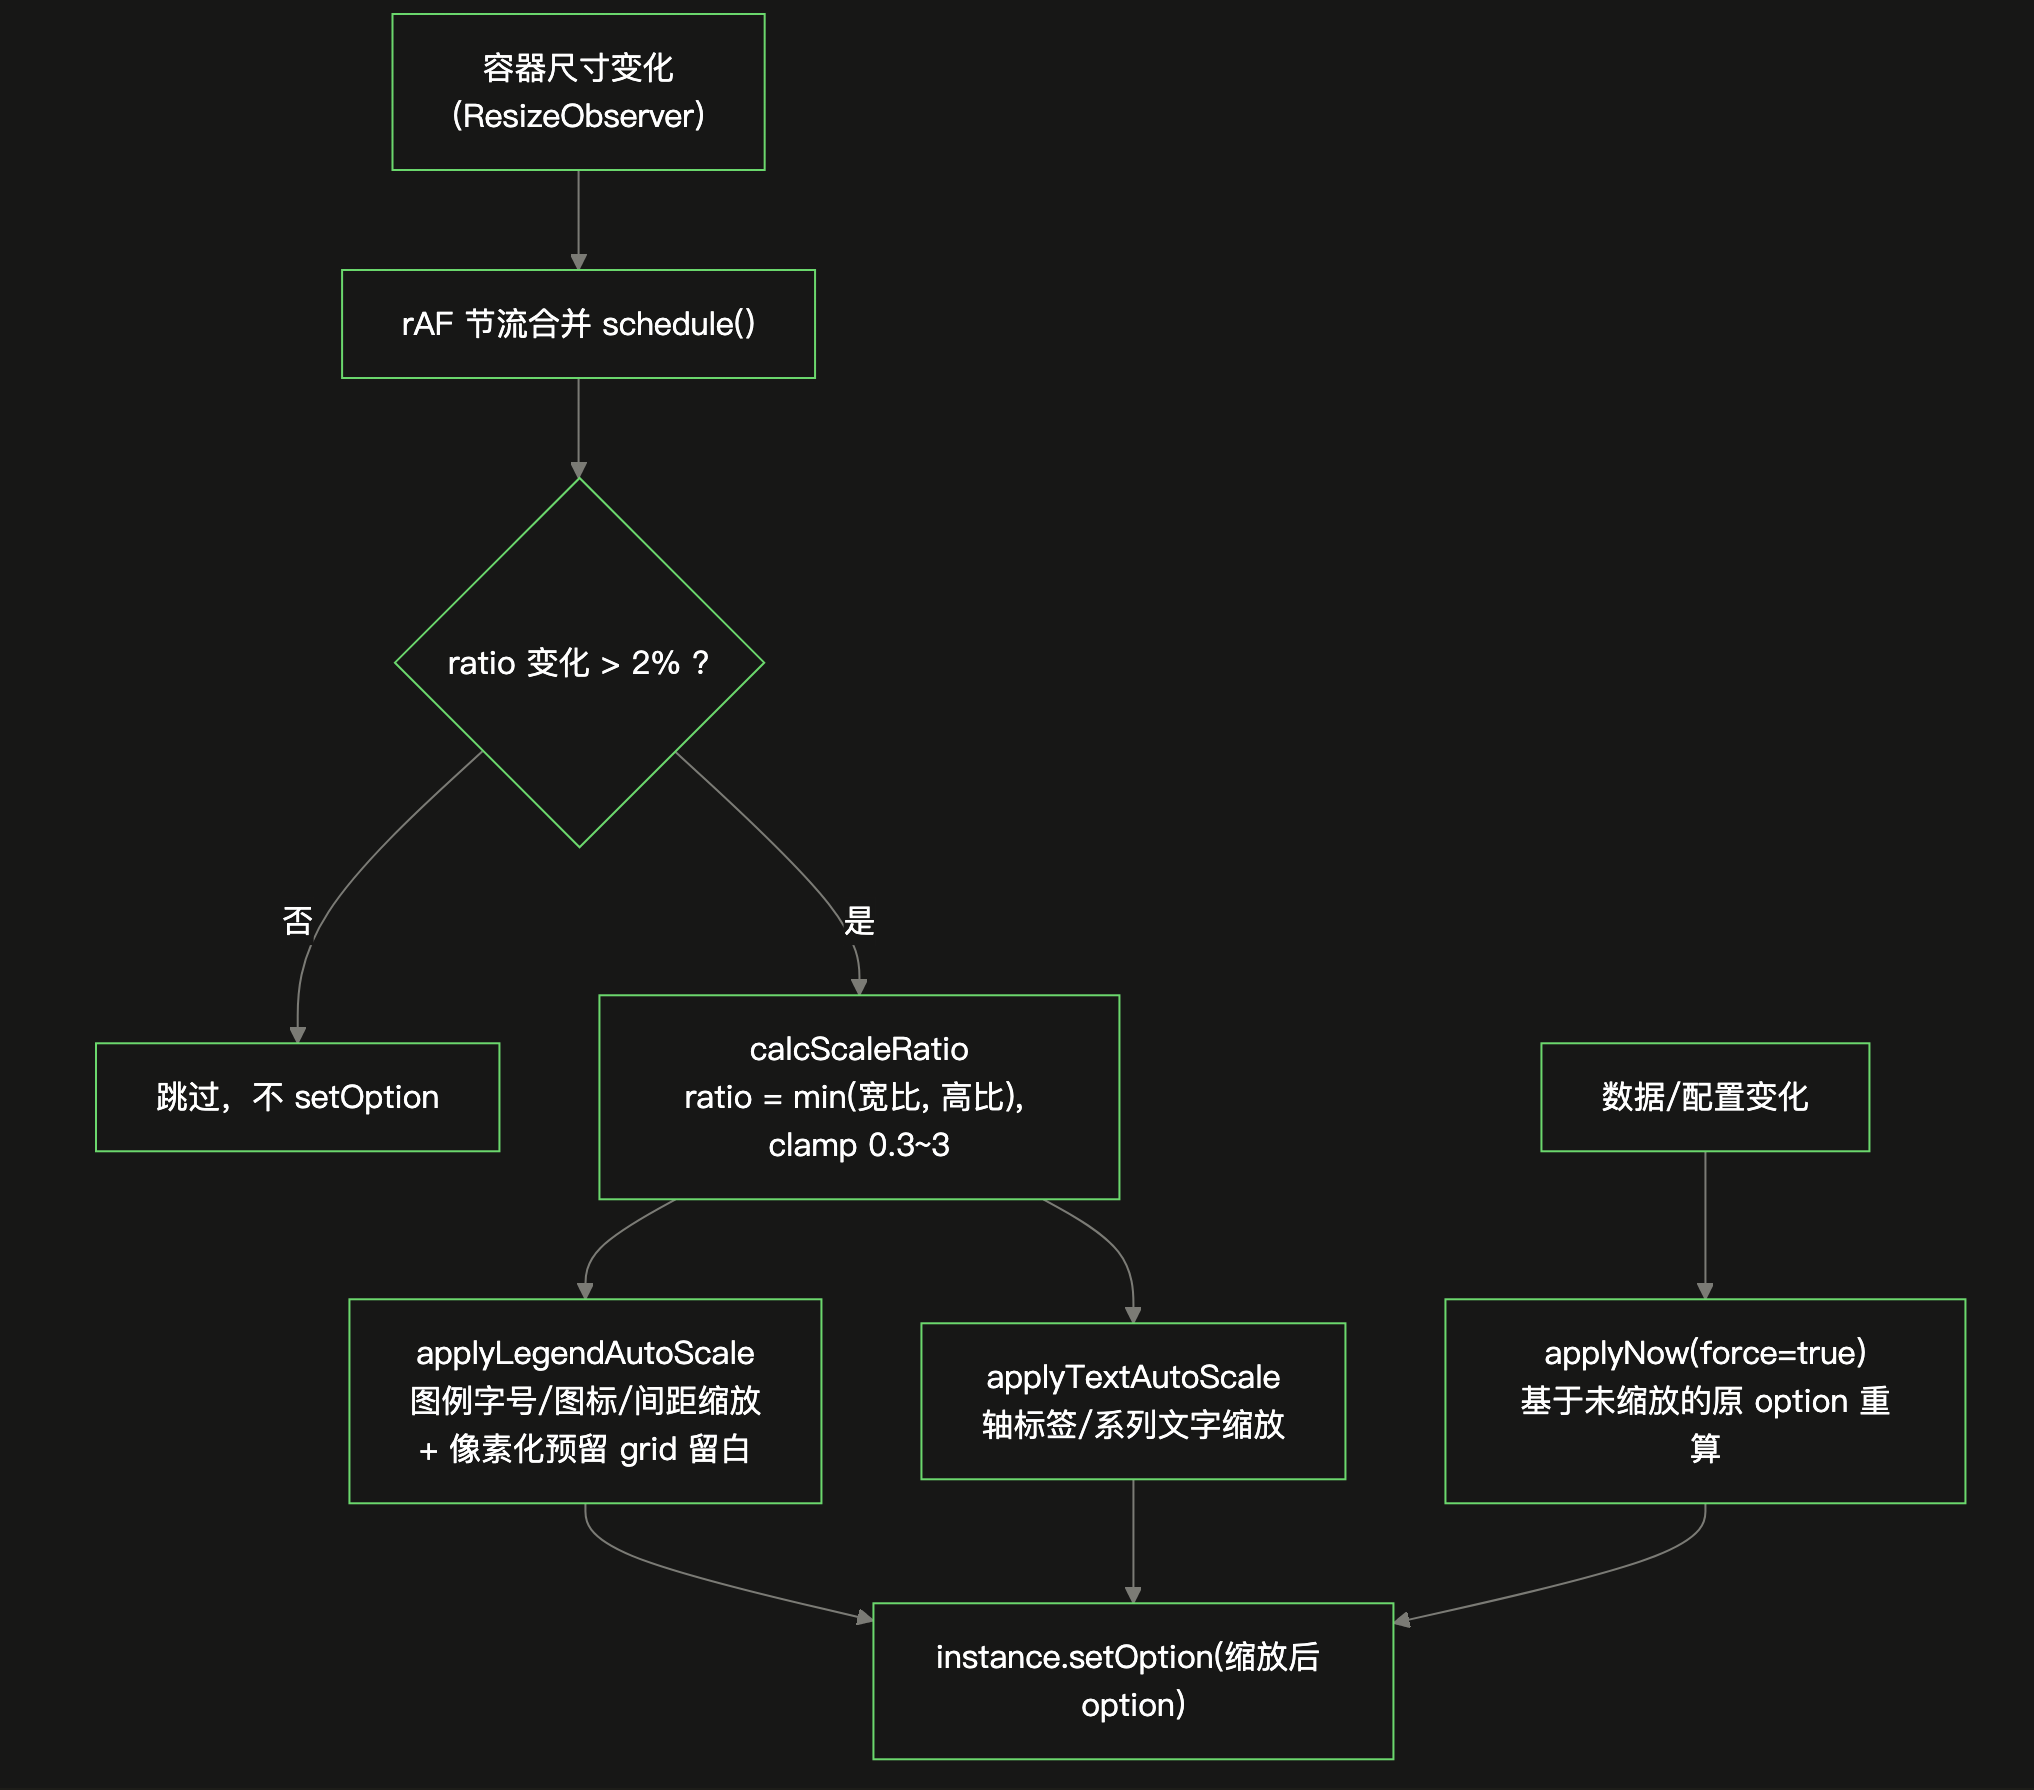
核心 hook 是 `src/hooks/useLegendAutoScale.js`,能力分两层:图例缩放 + 轴/系列文字缩放。整体流程如下:
第一步:计算缩放系数
/**
 * 计算缩放系数:容器实际尺寸相对基准尺寸的比例(clamp 0.3 ~ 3)
 */
const calcScaleRatio = (containerWidth, containerHeight, baseW, baseH) => {
  if (!containerWidth || !containerHeight || !baseW || !baseH) return 1;
  return Math.max(0.3, Math.min(3, Math.min(containerWidth / baseW, containerHeight / baseH)));
};
几个设计细节:
取 `min(宽比, 高比)`:保证在两个方向上都不溢出,等比缩放不变形;
`clamp` 到 `0.3 ~ 3`:防止极端尺寸下字号缩到看不见、或放到爆表;
基准尺寸 `baseW/baseH` 来自组件的 `attr.baseW ?? attr.w`,即用户拖拽前的原始设计尺寸。
第二步:图例缩放 + 动态预留空间
这是解决"图例遮挡"的关键。不仅要缩放图例自身的字号/图标/间距,还要根据缩放后的图例实际高度,用像素值动态覆盖 `grid.bottom/top`,取"像素预留值"与"用户设置值"的较大者:
const applyLegendAutoScale = (baseOption, ratio) => {
  const legend = baseOption?.legend;
  let bottomHeight = 0;
  let topHeight = 0;

  if (!legend || legend === true || legend.show === false) {
    return { option: baseOption, bottomHeight, topHeight };
  }

  const legendList = Array.isArray(legend) ? legend : [legend];
  const scaledLegends = legendList.map((item) => {
    const next = { ...item };
    // 字号缩放,下限 8px 保证可读
    const fontSize = item.textStyle?.fontSize ?? 14;
    const scaledFontSize = Math.max(8, Math.round(fontSize * ratio));
    next.textStyle = { ...(item.textStyle || {}), fontSize: scaledFontSize };
    // 图标、间距、内边距、边框同步缩放
    if (item.itemWidth != null) next.itemWidth = Math.max(4, Math.round(item.itemWidth * ratio));
    if (item.itemHeight != null) next.itemHeight = Math.max(4, Math.round(item.itemHeight * ratio));
    if (item.itemGap != null) next.itemGap = Math.round(item.itemGap * ratio);
    if (item.padding != null) {
      const pad = Array.isArray(item.padding) ? item.padding : [item.padding];
      next.padding = pad.map((v) => Math.round(v * ratio));
    }

    // 估算图例占位高度(单行):字号/图标较大者 + 上下内边距 + 间距
    const itemHeight = next.itemHeight ?? scaledFontSize;
    const padV = Array.isArray(next.padding)
      ? next.padding[0] + next.padding[2]
      : (next.padding ?? 0) * 2;
    const legendHeight = Math.max(scaledFontSize, itemHeight) + padV + 8;

    // 方位判定:图例在下方/上方时,累计需要预留的高度
    if (typeof item.bottom === "number") {
      bottomHeight = Math.max(bottomHeight, legendHeight + item.bottom);
    } else if (typeof item.top === "number") {
      topHeight = Math.max(topHeight, legendHeight + item.top);
    }
    return next;
  });

  const option = { ...baseOption, legend: Array.isArray(legend) ? scaledLegends : scaledLegends[0] };

  // 动态预留:以像素覆盖 grid 的百分比留白(与用户设置取较大者)
  if ((bottomHeight > 0 || topHeight > 0) && baseOption.grid && baseOption.grid.show !== false) {
    const grids = Array.isArray(baseOption.grid) ? baseOption.grid : [baseOption.grid];
    const firstGrid = grids[0];
    const patch = {};
    if (bottomHeight > 0) {
      const current = firstGrid.bottom;
      patch.bottom = Math.max(typeof current === "number" ? current : 0, bottomHeight);
    }
    if (topHeight > 0) {
      const current = firstGrid.top;
      patch.top = Math.max(typeof current === "number" ? current : 0, topHeight);
    }
    if (Object.keys(patch).length > 0) {
      const newGrids = [{ ...firstGrid, ...patch }, ...grids.slice(1)];
      option.grid = Array.isArray(baseOption.grid) ? newGrids : newGrids[0];
    }
  }

  return { option, bottomHeight, topHeight };
};
这里的精髓是:把"图例占多高"这件事从百分比改成精确像素计算。百分比留白在小图上必然不足,而像素计算 `legendHeight` 是实打实的,能保证绘图区永远给图例让出足够空间。
第三步:轴标签 / 系列文字缩放
图例搞定,还得处理坐标轴标签和数值标签——否则缩小后它们照样溢出被裁。
// 等比缩放单个像素值:未显式配置时套用 ECharts 默认值后再缩放
const scaleNumber = (value, defaultValue, ratio, min) =>
  Math.max(min, Math.round((value ?? defaultValue) * ratio));

const scaleAxisItem = (axis, ratio) => {
  if (!axis || typeof axis !== "object") return axis;
  const axisLabel = axis.axisLabel || {};
  return {
    ...axis,
    axisLabel: {
      ...axisLabel,
      fontSize: scaleNumber(axisLabel.fontSize, 12, ratio, 8), // 轴标签默认 12px
      margin: scaleNumber(axisLabel.margin, 8, ratio, 2)        // 标签与轴线间距默认 8px
    }
  };
};

const scaleSeriesItem = (series, ratio) => {
  if (!series || typeof series !== "object") return series;
  const label = series.label || {};
  const next = {
    ...series,
    label: {
      ...label,
      fontSize: scaleNumber(label.fontSize, 12, ratio, 8),
      // 饼图没有"数值标签间距"概念,不缩 distance
      ...(series.type === "pie" ? {} : { distance: scaleNumber(label.distance, 5, ratio, 1) })
    }
  };
  // 饼图改为缩放引导线长度
  if (series.type === "pie") {
    const labelLine = series.labelLine || {};
    next.labelLine = {
      ...labelLine,
      length: scaleNumber(labelLine.length, 15, ratio, 4),
      length2: scaleNumber(labelLine.length2, 15, ratio, 4)
    };
  }
  return next;
};
一个很讲究的细节:未显式配置的值,先套用 ECharts 官方默认值再缩放(`value ?? defaultValue`)。比如用户没设 `axisLabel.fontSize`,我们按默认的 12px 去乘 `ratio`,而不是跳过。否则没配置的文字就不会缩放,缩放过的和没缩放的混在一起反而更乱。
同时 `applyTextAutoScale` 在 `ratio === 1`(基准尺寸)时原样返回,保证对原始设计尺寸零影响——不能因为加了缩放逻辑,反而把用户精心调好的基准态改动了。
2.4 性能:别在每次 resize 都 `setOption`
大屏上图表多、拖拽频繁,如果每次 `ResizeObserver` 回调都 `setOption`,会造成大量重绘卡顿。hook 里做了两层节流:
const applyNow = useCallback((force = false) => {
  const instance = chartInstanceRef?.current;
  const element = chartRef?.current;
  if (!instance || !element || !optionRef?.current) return;

  const ratio = calcScaleRatio(element.clientWidth, element.clientHeight, baseW, baseH);

  // 系数变化小于 2% 时跳过,避免高频 resize 下无谓 setOption
  if (!force && lastRatioRef.current != null
      && Math.abs(ratio - lastRatioRef.current) / lastRatioRef.current < 0.02) {
    return;
  }
  lastRatioRef.current = ratio;

  const { option } = applyLegendAutoScale(optionRef.current, ratio);
  instance.setOption(applyTextAutoScale(option, ratio), true);
}, [chartRef, chartInstanceRef, optionRef, baseW, baseH]);

// rAF 节流入口(ResizeObserver 回调内调用)
const schedule = useCallback(() => {
  if (rafRef.current) return;
  rafRef.current = requestAnimationFrame(() => {
    rafRef.current = null;
    applyNow();
  });
}, [applyNow]);
两层节流:
1. `requestAnimationFrame` 合并:`ResizeObserver` 在一帧内可能触发多次,用 rAF 把它们合并成一次 `setOption`;
2. 2% 变化阈值:缩放系数变化小于 2% 直接跳过,人眼根本看不出差别,省掉大量重绘。
对外暴露两个入口,语义清晰:
`applyNow(force)`:数据/配置变化后强制立即应用(`force=true` 忽略阈值);
`schedule()`:容器尺寸变化时用,走 rAF 节流。
2.5 关键点:基于"未缩放的原 option"计算
有一个非常容易踩的坑:缩放必须始终基于原始未缩放的 option 来算,不能基于上一次缩放后的结果再缩放。
否则每次 resize 都在上一次的基础上再乘一次 `ratio`,误差会累积,图表越缩越离谱。项目里用一个 `optionRef` 专门保存"未缩放的最终 option",每次缩放都从它出发:
// 组件渲染时,把未缩放的最终 option 存进 ref
optionRef.current = defaultOption;
applyNow(true); // 缩放永远从 optionRef.current 出发,不累积

// 容器尺寸变化
resizeObserverRef.current = new ResizeObserver(() => {
  chartInstance.current?.resize();
  scheduleRef.current(); // 重新基于 optionRef.current 计算,天然无累积误差
});
2.6 接入方式
组件接入非常简单,以饼图为例:
const optionRef = useRef(null);
const { applyNow, schedule } = useLegendAutoScale({
  chartRef,
  chartInstanceRef: chartInstance,
  optionRef,
  baseW: attr?.baseW ?? attr?.w,
  baseH: attr?.baseH ?? attr?.h
});
目前 `EChartsBase`、`BarChart`、`LineChart`、`PieChart`、`RadarChart` 五个渲染端都接入了。地图组件用 `visualMap` 而非图例,不适用这套逻辑。
⚠️ 一个联动细节:饼图轮播模式下 legend 是强制隐藏的(`legend.show = false`),传给 hook 的 option 需要同步这个状态,否则缩放逻辑会为一个根本不显示的图例白白预留空间。
三、总结
这两个问题的共同点是:都不是业务逻辑 bug,而是"在高频、并发、脏数据环境下 ECharts 的边界行为",官方文档不会讲,但真实项目里必然遇到。

工程上的两点体会:
1. 对第三方库的"内部状态"保持敬畏但不迷信——`__flagInMainProcess` 是私有字段,但在明确的时序前提下(同步主流程已结束)复位它是安全且必要的。
2. 性能优化要落在"减少无谓重绘"上——rAF 合并 + 变化阈值 + 基于原始数据计算,三招组合让几十个图表同时拖拽也不卡。
如果你也在做可视化大屏 / 低代码图表编辑器,希望这两段踩坑记录能帮你少走弯路。